Ofgem’s price cap will rise to £1,736 a year from 1 October, the third increase in 12 months. That is the headline figure for a typical household using 12,000 kWh of gas and 2,900 kWh of electricity. But the number on your own bill depends on where you live, how old your boiler is, and whether your loft has 300 mm of mineral wool or a decade’s worth of forgotten Christmas decorations.
The latest average bill data from Uswitch, as reported by Uswitch, confirms what many homeowners already suspect: the national average is a useful benchmark but a poor predictor of your own bill. The data shows a typical dual-fuel household now pays £1,568 a year, but that figure conceals a brutal postcode lottery.
Where you live determines what you pay before you use a single kWh
Standing charges, the fixed daily fee for being connected to the grid, vary by region. In the North West, the daily standing charge for electricity is 58p. In London, it is 52p. That difference alone adds about £22 a year. Network costs, which Ofgem calculates separately for each of the 14 distribution regions, add another layer. Households in the South West pay roughly 15% more in network charges than those in the East Midlands, according to Ofgem’s 2024 network tariff data. The cumulative effect: a household in the South West on a standard variable tariff can pay up to £200 a year more than an identical household in the East Midlands, even with the same usage.
EPC ratings are the hidden multiplier
Geography is only half the story. The Energy Saving Trust estimates that a home with an EPC rating of D uses around 13,500 kWh of gas a year for heating, about 30% more than a C-rated home on 10,400 kWh. At the October price cap, that difference is roughly £260 a year. For a G-rated home, the gap widens to over £600. The cheapest bill is not the one with the lowest tariff. It is the one in the best-insulated house. Yet fewer than 40% of UK homes have an EPC rating of C or above, according to government data from 2023. The Great British Insulation Scheme closed on 31 March 2026. It funded insulation measures only and never covered windows or glazing.
What this misses, and what you can do about it
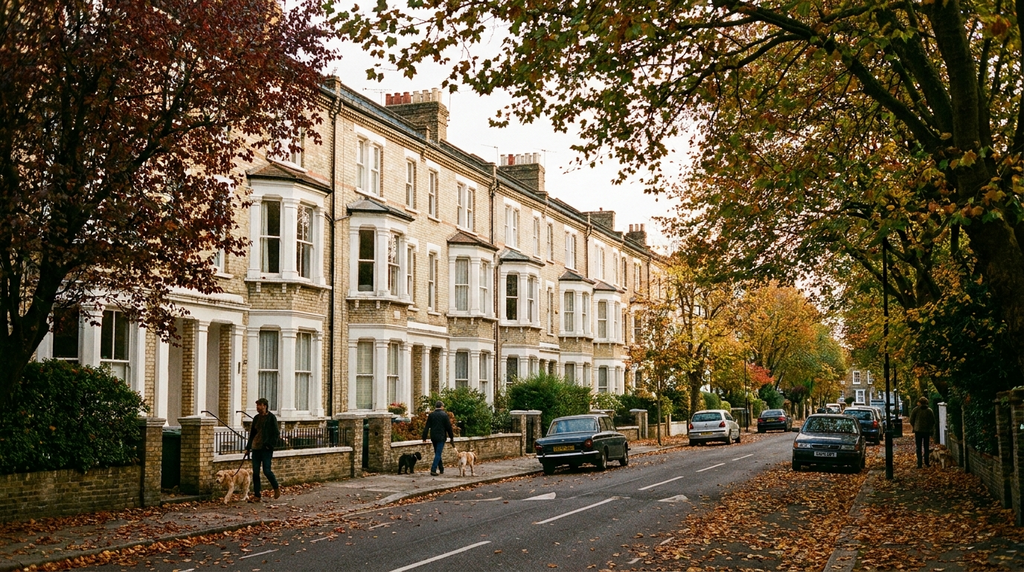
The catch is that average bill data treats all households as identical units of consumption. It does not capture the single parent in a draughty Victorian terrace paying £2,200 a year, nor the retiree in a well-sealed new-build paying £1,100. Nor does it reflect the 4.5 million households on prepayment meters, who face higher standing charges and cannot benefit from direct-debit discounts. For those households, the average is not a guide, it is a taunt. The practical response is not to fixate on the national number. It is to check your own EPC certificate, apply for insulation grants through gov.uk, and compare tariffs at least once a year. The next price cap change is due in January 2025. By then, every household that has topped up its loft insulation and switched to a fixed tariff will be paying less than the average. Everyone else will be funding the difference.
Frequently Asked Questions
The Energy Saving Trust estimates a D-rated home uses about 3,100 kWh less gas per year than a C-rated home. At the October 2024 price cap, that saves roughly £260 annually. The cost of cavity wall and loft insulation is typically recouped within two to five years.
No. Standing charges vary by region and by supplier. Ofgem sets a maximum for each region, but suppliers can charge less. The current range is roughly 48p to 62p per day for electricity and 27p to 34p per day for gas. Switching supplier will not change your standing charge region, but it can reduce your unit rate.