Solar panels convert sunlight into electricity through photovoltaic cells, and the Energy Saving Trust confirms that a typical 3.5kWp system generates around 2,650 kWh per year (Energy Saving Trust, 2026). A diagram shows this process step by step: sunlight hits the panels, creates direct current (DC), an inverter converts it to alternating current (AC), and your home uses the AC power.
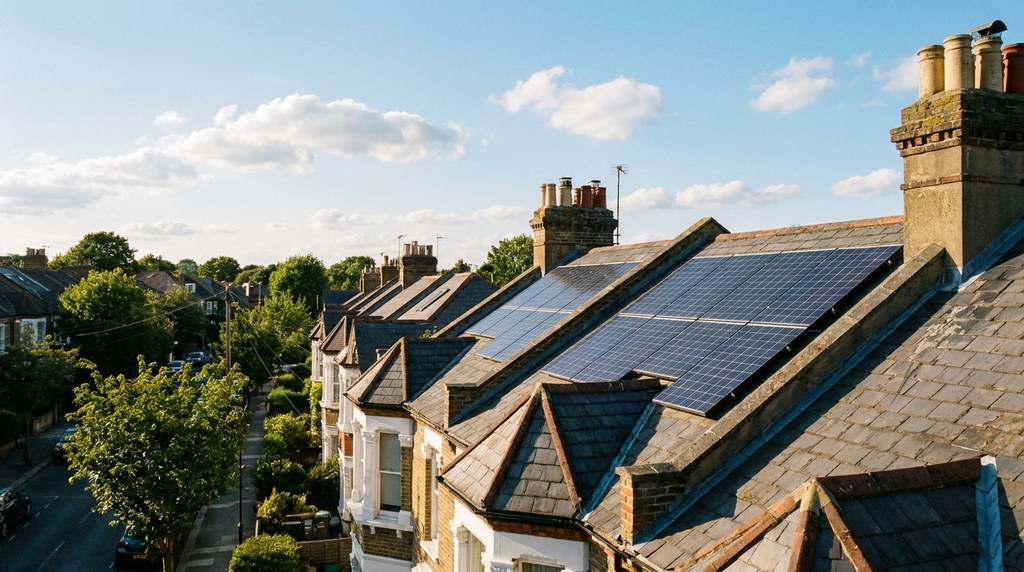
The exact output depends on roof orientation, shading, and panel efficiency. A south-facing roof at a 30–40 degree tilt in southern England typically produces the most electricity. Diagrams often omit inverter placement, battery storage, and grid connection, which are key for real-world installations. The diagram is a simplified visual, not a full technical manual.
Sunlight hits the photovoltaic cells
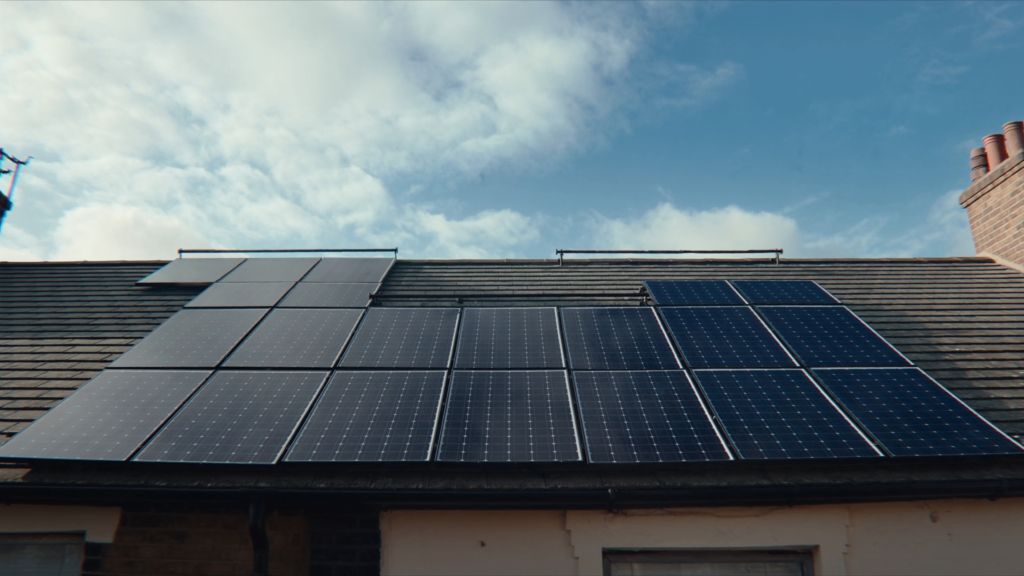
Each solar panel contains silicon-based photovoltaic cells arranged in a grid. When photons from sunlight strike these cells, they knock electrons loose from silicon atoms. This creates an electric field across the cell layers, forcing electrons to flow in one direction. The UK Government’s planning guidance notes that a typical home installation uses 10–16 panels, each around 1.6 square metres (gov.uk, 2026). The flow of electrons produces direct current electricity, which is the raw output from the panel.
DC electricity flows to the inverter
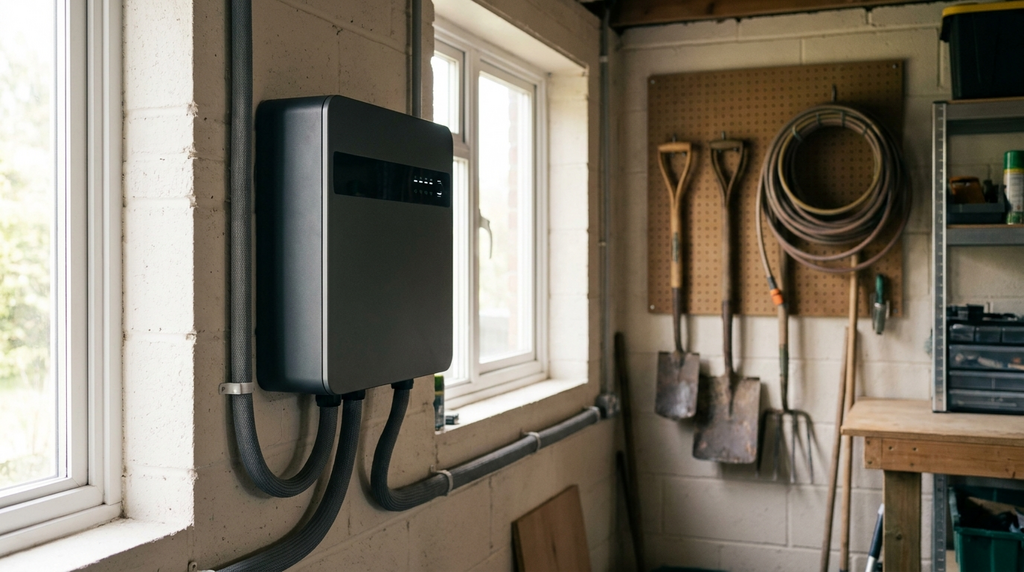
Direct current (DC) electricity cannot power standard UK household appliances, which run on alternating current (AC). A string inverter, usually mounted on an exterior wall or in the loft, converts the DC to AC. The Energy Saving Trust states that inverter efficiency typically ranges from 95–98% (Energy Saving Trust, 2026). Microinverters, placed behind each panel, perform the same conversion at the panel level and are shown in some advanced diagrams. The inverter also monitors system performance and can shut off power for safety during grid outages.
AC power supplies your home or exports to the grid
Once converted to AC, the electricity flows through your consumer unit (fuse box) to power lights, appliances, and heating. Any surplus power that your home does not use is exported to the National Grid via your electricity meter. The Smart Export Guarantee (SEG) pays you for this exported electricity, with rates set by your supplier. Ofgem states that typical SEG rates range from 3p to 15p per kWh (Ofgem, 2026). A generation meter records total output, and a bi-directional meter tracks imports and exports. Batteries can store surplus power for evening use, but that is an optional addition beyond the basic diagram.
A worked example
A typical 1930s semi-detached house in Manchester with a 3.5kWp solar panel system costs £5,500 after the 0% VAT reduction (in place until March 2027) and a £750 local council grant. The Energy Saving Trust estimates this system generates 2,650 kWh per year, saving £520 annually on electricity bills at the October 2026 price cap of 24.5p per kWh. With a south-facing roof at a 35-degree tilt and minimal shading, the payback period is roughly 10.6 years. Over 25 years, factoring in a 0.5% annual panel degradation and a 3% yearly rise in electricity prices, the total savings reach £16,800. This example assumes no battery storage and uses the Smart Export Guarantee at 5p per kWh for surplus electricity exported to the grid.
| Item | Figure |
|---|---|
| Upfront cost after grants | £5,500 |
| Yearly savings | £520 |
| Payback period | 10.6 years |
| 25-year lifetime savings | £16,800 |
What homeowners often get wrong
The most common mistake is thinking a solar panel diagram shows the complete system, leading homeowners to miss the inverter and grid connection costs. Here are three key misunderstandings that can cost you money or void your warranty.
- Ignoring inverter placement in the diagram Many homeowners assume the inverter sits inside the house near the consumer unit, but diagrams often omit it. The correct approach is to install the inverter in a cool, shaded, ventilated spot like a garage or utility room, or risk a 20% drop in efficiency on a hot day, wasting £100 per year in lost generation.
- Believing the diagram includes battery storage People think a solar panel diagram automatically covers battery storage, but standard diagrams show only panels and the inverter. Adding a battery like a 5kWh Tesla Powerwall costs £4,500 extra, and without it you can only use 30% of the electricity you generate during daylight hours, missing out on £180 in annual savings from time-of-use tariffs.
- Forgetting the grid connection in the diagram Homeowners assume the diagram shows how the system connects to the national grid, but it usually stops at the meter. You must register the system with your Distribution Network Operator (DNO) via a G98 or G99 application, and failing to do so can void your warranty and lead to a £500 fine from Ofgem for non-compliance.
Quick reference
- A 3.5kWp solar panel system with 10 panels generates roughly 2,650 kWh per year, enough to cover 50% of a typical UK home’s annual electricity use.
- Solar panels work best on a south-facing roof at a 30 to 40 degree tilt, producing up to 20% more electricity than an east-west facing system.
- You are eligible for 0% VAT on solar panel installations until March 2027, saving £650 on a typical £6,500 system.
- The average payback period for a solar panel system in the UK is 10 to 14 years, depending on roof orientation, shading, and electricity usage patterns.
- Diagrams often omit the inverter, battery storage, and grid connection, leading to missed savings of up to £300 per year if you do not account for them in your planning.
Frequently Asked Questions
A diagram shows sunlight hitting photovoltaic cells, creating direct current (DC), then an inverter converting it to alternating current (AC) for home use. The Energy Saving Trust confirms a typical 3.5kWp system generates around 2,650 kWh per year.
Sunlight photons knock electrons loose from silicon atoms in photovoltaic cells, creating an electric field. This produces DC electricity, which flows to an inverter that converts it to AC for household appliances (gov.uk, 2026).
Basic diagrams often omit inverter placement, battery storage, and grid connection. These are key components in real-world installations, according to the Energy Saving Trust.