1. Check your generation meter weekly
Your generation meter is the most reliable way to measure exactly how much electricity your solar panels have produced. It records total kilowatt-hours (kWh) over time, giving you a definitive figure for your system’s output.
- Record the kWh reading from your generation meter every seven days to track total output (MCS, 2026).
- Compare readings week-on-week to spot sudden drops that may indicate a fault (Energy Saving Trust, 2026).
If you see a sharp decline with no obvious weather cause, it is time to investigate further. A generation meter costs nothing if already installed, or up to £50 to retrofit.
2. Read your inverter display daily
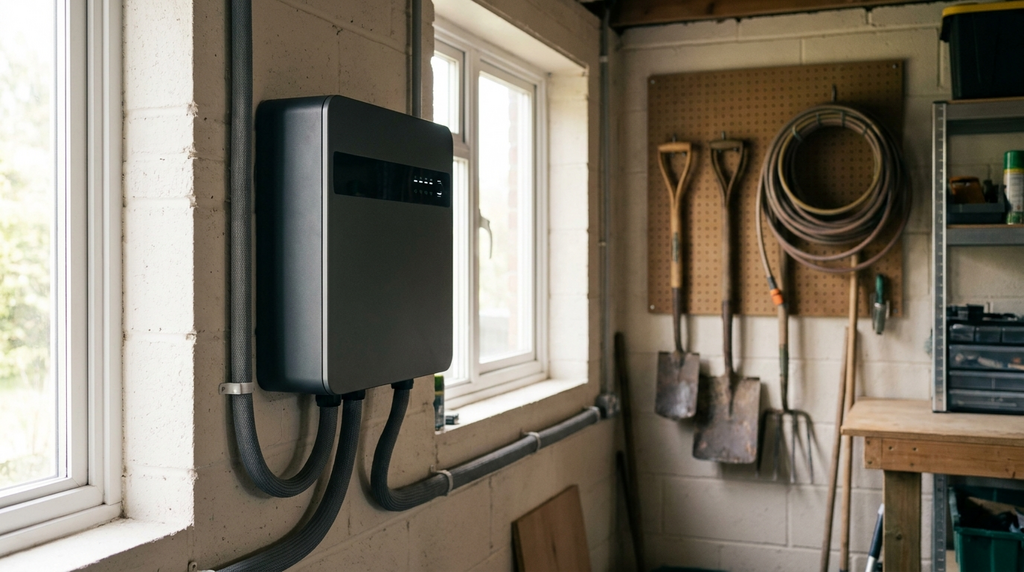
Your inverter converts the direct current (DC) from your panels into usable alternating current (AC). Its display shows real-time power output in kilowatts (kW) and cumulative energy in kWh. That makes it a quick check for system health.
- View live kW output and cumulative kWh on your inverter screen to confirm the system is running (MCS, 2026).
- Note the time of day and weather conditions to understand normal performance ranges (Energy Saving Trust, 2026).
This takes just 30 seconds. Over time, you will learn what your system typically produces at midday in summer versus a cloudy winter afternoon.
3. Use your inverter manufacturer’s app
Most modern inverters come with a free smartphone app that shows real-time and historical data. Brands like SolarEdge, Enphase, and Huawei offer these apps as standard.
- Download the free app for your inverter brand to see real-time and historical data (Energy Saving Trust, 2026).
- Set up notifications for system errors or low output alerts (MCS, 2026).
Apps are the easiest way to check daily trends without going outside. They are free and update every few minutes.
4. Compare smart meter export readings
If you have a smart meter installed, it can show how much electricity you export to the grid. This is useful for cross-checking your generation meter and for claiming Smart Export Guarantee (SEG) payments.
- Check your smart meter’s export reading to see how much energy you send to the grid (Ofgem, 2026).
- Cross-reference export data with your generation meter to verify accuracy (Energy Saving Trust, 2026).
Your export reading should roughly match your generation minus what you used at home. A large mismatch could mean a meter fault or a wiring issue.
5. Log output on a spreadsheet
Writing down your readings creates a long-term record that helps you spot seasonal patterns and gradual degradation. A simple spreadsheet is free and takes minutes per week.
- Record daily or weekly kWh figures in a simple spreadsheet to identify long-term trends (Energy Saving Trust, 2026).
- Include weather notes to understand seasonal variation in output (MCS, 2026).
After a year, you will have a clear picture of what your panels produce in each season. This baseline makes it easy to detect when something changes.
6. Install a dedicated monitoring system
For the most detailed insight, third-party monitoring systems give you per-panel data, energy consumption breakdowns, and real-time alerts. They are useful if you want to pinpoint exactly which panel is underperforming.
- Add a third-party monitor like the Owl Intuition or Geo Solo to get per-panel data and alerts (Energy Saving Trust, 2026).
- Expect to pay £100–300 for hardware and setup (Energy Saving Trust, 2026).
These systems connect to your consumer unit and use sensors on each panel string. They are not essential for most homes but are valuable if you have shading or complex roof layouts.
7. Watch for inverter warning lights
Your inverter has status lights that indicate whether it is operating normally, in standby, or has a fault. A quick visual check each day can catch problems early.
- Check your inverter’s status lights daily, a red or flashing light signals a fault (MCS, 2026).
- Refer to your inverter manual to interpret specific error codes (MCS, 2026).
Common issues include grid voltage trips, temperature warnings, or communication errors. Most faults clear themselves, but a persistent red light means you should call your installer.
8. Review your annual MCS certificate
Your Microgeneration Certification Scheme (MCS) certificate includes an estimated annual output for your system. Comparing this to your actual generation helps you judge whether your panels are performing as expected.
- Compare your annual generation meter reading to the estimated output on your MCS certificate (MCS, 2026).
- A variance of more than 10% may indicate a system issue or shading problem (Energy Saving Trust, 2026).
Keep your MCS certificate handy. If output is significantly lower than estimated, your installer may need to inspect the system.
9. Monitor shading changes over time
Shading is one of the biggest causes of lost solar output. Trees grow, new buildings go up, and even a single shaded panel can reduce the whole string’s performance.
- Note new tree growth or building work that could cast shade on panels and reduce output (Energy Saving Trust, 2026).
- Use your inverter data to check if output drops during shaded times of day (MCS, 2026).
If you notice a pattern of low output at certain times, walk outside and look for new shade sources. Trimming trees or repositioning panels may restore lost generation.
10. Schedule a professional system check
Some faults are invisible to the homeowner. Loose wiring, failing diodes, or micro-cracks in panels need a trained eye and specialist equipment to detect. A biennial check by a qualified installer is money well spent.
- Hire an MCS-accredited installer every two years to test panel output and wiring (MCS, 2026).
- A full check costs £100–200 and can catch faults you cannot see (Energy Saving Trust, 2026).
The installer will test each panel’s voltage and current, inspect the inverter and meter, and check for loose connections. This is the most thorough way to confirm your system is running at its best.
| Method | Accuracy | Cost (GBP) | Source |
|---|---|---|---|
| Generation meter reading | High (kWh exact) | £0–50 | MCS, 2026 |
| Inverter display check | High (kW real-time) | £0 (built-in) | MCS, 2026 |
| Manufacturer app/portal | Medium (daily totals) | £0–free | Energy Saving Trust, 2026 |
| Smart meter integration | Medium (import/export) | £0 (if fitted) | Ofgem, 2026 |
| Third-party monitoring kit | High (per-panel data) | £100–300 | Energy Saving Trust, 2026 |
Monitoring your solar panel output does not need to be complicated. A weekly generation meter reading and a quick glance at your inverter display are enough for most homes, while manufacturer apps and smart meters give you more detail for free. For the best long-term performance, combine these simple checks with a professional inspection every two years.
How to read your solar inverter display
<a href="https://axiomecohomes.co.uk/solar-panels-guide/solar-panel-maintenance/">Solar panel maintenance</a> checklist for UK homes
Smart Export Guarantee rates and how to claim
Frequently Asked Questions
Check your generation meter weekly to track total kWh output. The Energy Saving Trust recommends comparing readings week-on-week to spot sudden drops that may indicate a fault (Energy Saving Trust, 2026).
Your inverter display shows real-time power output in kilowatts (kW) and cumulative energy in kWh. This provides a quick 30-second check to confirm your system is running normally (MCS, 2026).
Yes, most modern inverters from brands like SolarEdge, Enphase, and Huawei come with a free smartphone app. These apps show real-time and historical data, and you can set up notifications for system errors (Energy Saving Trust, 2026).
Yes, a smart meter can show how much electricity you export to the grid. This is useful for cross-checking your generation meter and claiming export payments (Ofgem, 2026).
If you see a sharp decline with no obvious weather cause, investigate further. Check your inverter display, generation meter, and app for errors, and contact your installer if needed (Energy Saving Trust, 2026).